Chapter 2
The UK's Energy System
Through the 2020s and beyond, the UK is likely to see a significant rise in renewable generation, predominantly from large-scale wind and solar PV. Though flexible generation capacity will remain at approximately existing levels, most scenarios show it generating less electricity. Electrical demand will rise gradually during the 2020s, then rapidly in the 2030s, to supply EVs and electrified heating.
2.1 National energy supply and demand
In 2019 the UK’s total primary energy consumption was 141,951 ktoe (1651 TWh), predominantly from fossil fuels: petroleum products (44%) and natural gas (31%) (Figure 1(a)) (BEIS, 2020a). Figure 1(b) & Figure 1(c) shows this consumption by end use; the greatest use of energy is for heating (45%) followed by transport (41%). Oil (petroleum) provides 96% of energy for transport while gas meets 66% of the demand for heat. As these figures are in terms of primary energy, the energy to meet different uses will be less, depending on the efficiency of the process.
Figure 1. UK primary energy consumption (BEIS 2020a)
Fuels used in electricity supply have changed significantly over the last 30 years (Figure 2), in particular the decline of coal (BEIS, 2020a; BEIS, 2019b). This is characterised by a shift to gas-fired power stations in the 1990s, followed by increasing renewables in the last decade. Carbon dioxide emissions from power stations in 2019 are almost a quarter of what they were in 1990.
Figure 2. Electricity supply, by fuel type, and annual CO2 emissions from power stations. (BEIS 2020b, BEIS 2019)
The seasonal variability of demand is shown in Figure 3(a), centred on the winter of 2017/18 to show a late cold snap that hit the UK (the ‘beast from the east’). Average daily demand for gas in the winter is about four times that in the summer, with a peak demand that year 50% higher still. Figure 3(b) shows hourly demand for electricity and gas for the median demand week and peak demand week over the winter(Wilson et al, 2018); the authors found that the variation in electricity demand between 05:00 and 08:00 on February 28th was 11 GW, whilst for gas demand it was 116 GW, with peak demand for gas during this period reaching 214 GW at 18:00 on March 1st.
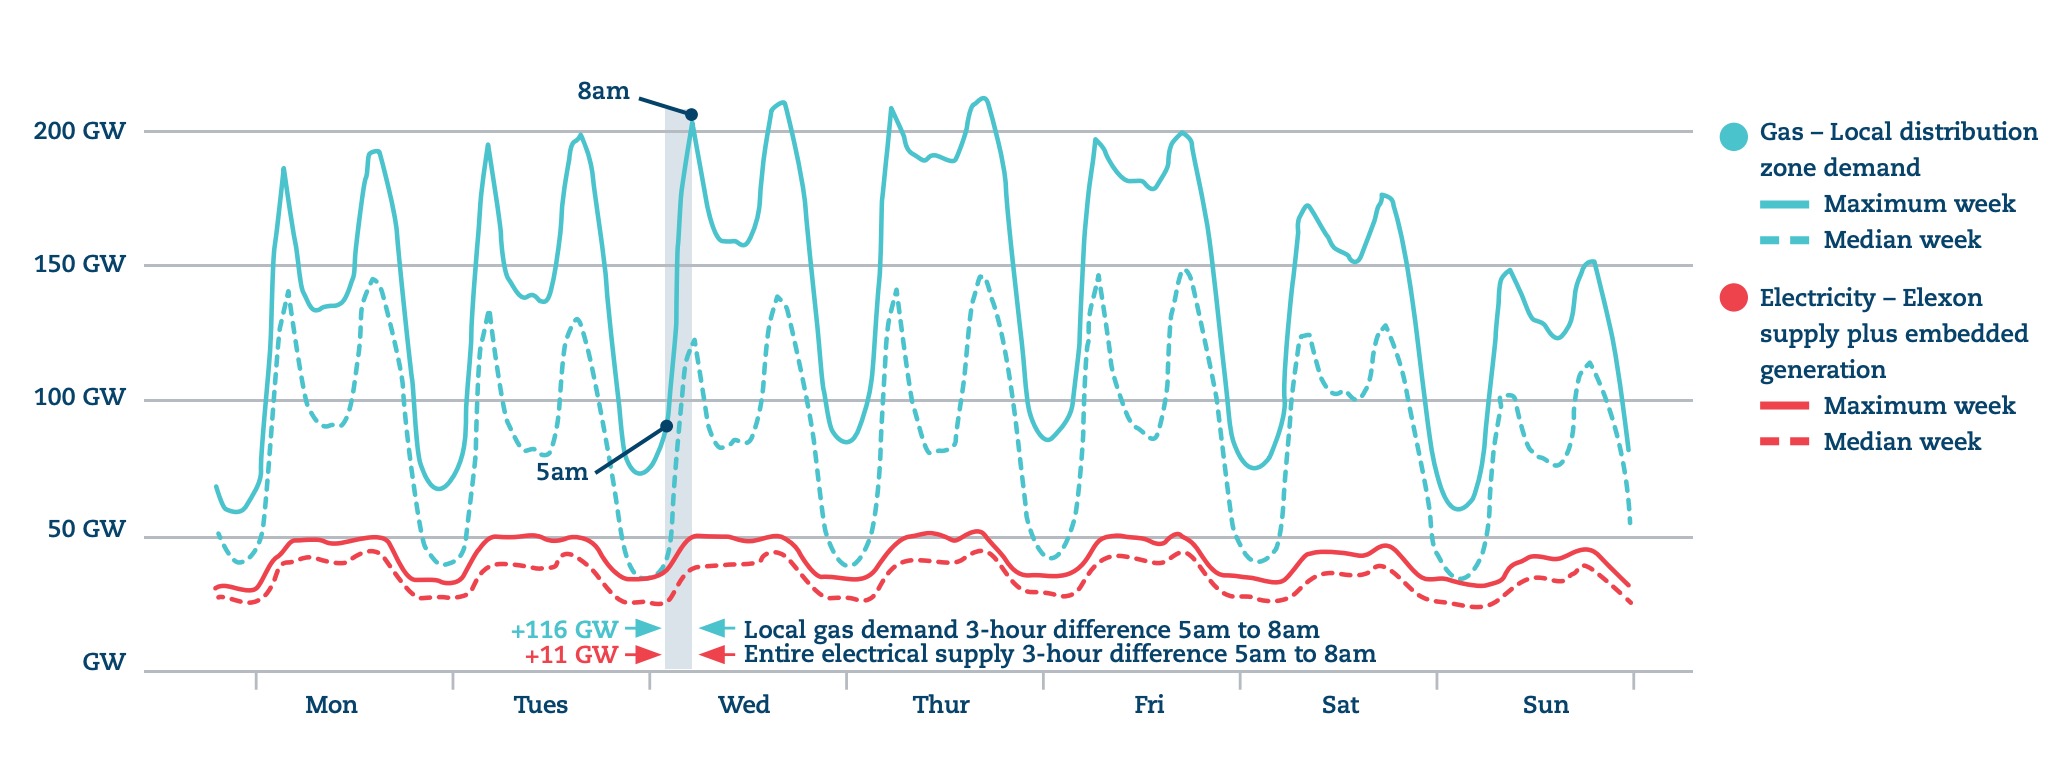
Figure 3. Variability of energy demand
Supply and demand also vary at a sub-national scale; electricity consumption and local generation by month are shown for Cornwall, Birmingham and Scotland in Figure 4. In Cornwall, solar PV generation is about a quarter of demand in the summer months, while in Scotland generation from wind is consistently almost half of electricity demand across the year. In Birmingham, local generation is very low compared to demand, despite the growth in domestic PV installations.
Figure 4. Sub-national generation and consumption 2016
2.2 Energy system scenarios
Climate change policy has been the key driver for energy system change in the UK, with the ‘net zero’ target put into legislation in 2019 (House of Commons Library, 2019). However, there have been targets for the large-scale deployment of low-carbon electricity generation to reduce carbon emissions since 2000 (DTI, 2003; House of Commons Library, 2019). At the same time, industrial strategies have responded to the national and international opportunities these policies have created (BIS, 2012, HM Government, 2017), whilst governments have also made commitments to reduce bills for consumers. Maintaining or enhancing energy security (however interpreted) has also been a thread running through these interventions (Kern et al, 2014).
Scenarios and models give insights on how the energy system could evolve. They can be an effective way of exploring possible futures from a whole systems perspective, integrating supply and demand.
To understand how flexibility and reliability will become an increasingly important issue for the UK, hence provide an opportunity for different types of energy storage, three sets of energy system scenarios were considered:
- National Grid (NG) Future Energy Scenarios 2020 ‘Consumer transformation’ and ‘System transformation’ (FES CT and FES ST respectively) (National Grid, 2020). Both scenarios meet ‘net zero’, the main features of each being:
- FES CT: Electrified heating, consumers are willing to change behaviour, high energy efficiency, demand side flexibility
- FES ST: Hydrogen for heating, consumers less inclined to change behaviour, lower energy efficiency, supply side flexibility
- Energy Systems Catapult (ESC) ‘Clockwork’ and ‘Patchwork’ Net Zero 2050 pathways (ESC CW and ESC PW) from the energy system modelling environment (ESME) (ESC, 2020):
- ESC CW: Coordination from central Government drives long term investment in strategic energy infrastructure in the power sector, nuclear and wind generation are underpinned by support to develop the supply chain and workforce. Markets are created for negative emissions with carbon capture and storage, domestic biomass and afforestation.
- ESC PW: Central Government takes less of a leading role, resulting in a patchwork of regional low carbon or carbon neutral strategies. Nuclear is limited to three large power stations and a few smaller modular reactors. Offshore wind, distributed solar PV and other renewable energy supply most of the electricity. Without central support, CCS and domestic biomass struggles to grow, but the public supports big growth in woodland.
- Department for Business, Energy and Industrial Strategy (BEIS) Energy and Emissions Projections 2019 ‘Reference’ scenario from (EEP REF) (BEIS, 2020c):
- This is the core analysis of how the UK energy and emissions system could evolve under central assumptions about how the system drivers will change. It includes government policies which have been implemented, adopted, or planned as at August 2019. It excludes new policies and changes to existing policies which fall outside these categories.
The outputs from modelled scenarios were used to assess the scale and timing of future supply from different types of generation, as well as changes in energy demand. The scenarios shift demand for fossil fuels predominantly to electricity or hydrogen, with all showing a 50 – 100% increase in electricity generation by 2050 (Figure 5(a)). Levels of hydrogen production are a key feature of the different scenario descriptions, and evident in Figure 5(b).
On the supply side, electricity generation from nuclear base load, flexible plant and variable renewables is shown for each scenario in Figures 6 (a) – (c),with installed electrical capacity in Figures 7 (a) – (c).
On the demand side, Figure 8(a) shows electrical demand for heating and cooling under the FES CT, FES ST, ESC CW and ESC PW scenarios (EEP scenarios do not show this metric). Figure 8(b) gives electricity demand for EVs under all five scenarios.
Figure 5. Electricity and hydrogen production
Figure 6. Electricity generation by source
Figure 7. Electricity generation capacity by source
Figure 8. Electrical demand
Key observations from the analysis of the scenarios are that:
- Installed capacity of flexible plant, including new interconnectors, is relatively unchanged to 2050, though the level of electricity generated decreases to between half and two-thirds of the current level by 2035, indicating a steep decline in load factor.
- New nuclear plant is expected to be built from the mid-2020s, replacing decommissioned plant, with baseload generation then increasing modestly to 2050 in NG and BEIS scenarios, a more rapid growth in ESC scenarios.
- Variable renewable sources will increase rapidly in the 2020s and 2030s, according to NG scenarios; however scenarios from ESC and BEIS are much more conservative.
- Decentralised electricity generation will increase and be significant in some regions, but generation connected to the transmission network is still likely to dominate at a national level through the 2020s.
- Electricity demand for heating/cooling rises in all scenarios, more rapidly in ESC scenarios and NG FES CT. In contrast, the NG FES ST scenario uses hydrogen to meet heat demand to a much greater degree.
- All the scenarios show a rapid increase in transport demand for electricity from 20 TWh/year in 2030 to 80 TWh/year in 2040.
Overall, electrification of the transport and heat sectors increase the net demand for electricity to a greater or lesser degree. There is the potential to manage this ‘smartly’, that is by incentivising the consumption of electricity during periods of low demand to mitigate the impact these sectors have on peak electrical demand (Carbon Trust, 2016).
A field study found that smart charging of heat pumps could reduce their consumption during peak demand times by 30% although the level of reduction is heavily dependent on the building stock (Delta Energy & Environment, 2018). National Grid’s FES scenarios use smart charging to limit this increase in peak demand 6 GW by 2050 (National, Grid 2020). A recent study found this peak demand increase could be reduced to as little as 0.5 GW (Aurora Energy Research, 2018).
By 2030, when generation from renewables, will have increased, and electricity from fossil fuel is being phased-out, but before large-scale demand-side electrification, there could be severe electricity system challenges. The figure below shows the difference between electrical demand and generation over a winter week, with levels of wind generation and solar PV scaled to that of 2030 from National Grid scenarios. This ‘residual load’ is at a scale of 10 - 20 GW for several days, reaching a deficit of over 1 TWh when the wind drops, but in surplus by 100s GWh during high wind periods. The scenarios do also have 16 – 21 GW of interconnection to other European countries (an increase from 5 GW in 2020), but this is not guaranteed supply.
Residual Load Balance
Residual Load
2.3 Key points from expert workshop
An expert workshop held in 2018 assessed scenario outputs, drawing on previous reports from National Grid and ETI (National Grid, 2017a; ETI, 2015) from which the above scenarios have evolved. Participants were asked to consider key challenges faced under each scenario and any commonalities/differences between scenarios. From the feedback received a number of challenges likely to be faced by the energy system over the next 10 - 15 years were identified. The main themes were changes in demand patterns largely due to electrification; increased supply from variable renewable sources; and a greater impact of geographic variability due to an increase in decentralised generation. This is in line with several of the key observations from the model output.
Key points made were:
Demand
- Behaviour patterns of EV charging could increase peak demand, or shift it later into the evening. There is a large uncertainty in how (fast or slow-charging) and when charging will occur, which would have a significant impact on infrastructure needs.
- Daily heat demand profile is different to that of electricity, so even a part-electrification of the heat sector would change the electricity demand profile.
- Seasonal variation in heat demand is a critical factor that needs to be managed.
Supply
- The consequences of a loss of inertia in grid network will become more acute as variable renewables approach 50% grid penetration; NG FES scenarios indicate this will be the case in the mid – late 2020s.
- More active management from increasing RES over multiple timescales: 4 - 5 day periods with no wind, diurnal variation in solar irradiation.
Geographic variability
- The current system is not designed for an increase in embedded generation, more nodes on the network will increase fault currents.
- As embedded generation increases geographic variability is becoming an increasingly important factor with different challenges in different places, demand changes with location but as variable RES generation increases so does supply.
2.4 Conclusions
Through the 2020s and beyond, the UK is likely to see a significant rise in renewable generation, predominantly from large-scale wind and solar PV. Though flexible generation capacity will remain at approximately existing levels, most scenarios show it generating less electricity. Electrical demand will rise gradually during the 2020s, then rapidly in the 2030s, to supply EVs and electrified heating. Such demand could be managed ‘smartly’, but there is still likely to be a large amount of energy from variable renewables with a reduced demand for other energy services, such as lighting, as they become more efficient.
The seasonality and location of supply and demand will also have a big impact on the energy system. Whilst more generation becomes embedded at a distribution network level in many parts of the country, large demand centres and generation (from thermal and renewable sources) will remain. The demand for heat will continue to dominate the UK’s energy system, addressing its scale and variability is the biggest challenge for decarbonisation through the 2020s.